
Once the estimation of a regression model is complete, we would like to know how good the fit of our estimated model is. In other words we would like to know how well the estimated line fits the data / sample observations. That is when the F-statistic and R-squared come into play.
What is F-statistic?
The F-statistic is a key test statistic used in regression analysis, ANOVA (Analysis of Variance), and other statistical models to assess the overall significance of a model or compare the fits of different models. It helps to determine whether a group of variables jointly has a statistically significant effect on the dependent variable.
Suppose we have a linear regression model like the one below
Yi = α +Yi = α + β1X1 + β2X2 + β3X3 + … + βnXn +εi
Where Y is the dependent variable and X1,X2,X3 are the predictors.Now, the hypothesis to test overall significance of the model will be like
- HN (Null Hypothesis): β1 = β2 = β3 = … = βn =0
- HA (Alternative Hypothesis): Not all βs are simultaneously zero
The F statistic can be constructed as follows

where k is the no of parameters in the model and n is the number of observations. ESS and RSS are nothing but explained sum of squares and Residual sum of squares.
ESS = TSS – RSS (where TSS is total sum of squares)
We basically check the significance of F statistics at the chosen level of significance. So, if the estimated F statistic is greater than the critical value at the chosen level of significance and degree of freedom, we can reject the null hypothesis and conclude that there is overall significance of the estimated regression model and vice versa.
When is the F-Statistic Used?
| Application | Purpose |
|---|---|
| Regression Analysis | Test if the overall model is significant. |
| ANOVA | Compare means across multiple groups. |
| Panel Data Models | Choose between pooled OLS, fixed effects, or random effects. |
| Nested Model Comparison | Check if adding more predictors improves fit (e.g., restricted vs. unrestricted models). |
Limitations of the F-Statistic
- Sensitive to Sample Size: Large datasets can make even tiny effects statistically significant.
- Assumes Normality & Homoskedasticity: Violations (e.g., heteroskedasticity) can distort results.
- Only Tests Joint Significance: Does not tell which specific predictors are significant (use t-tests for individual coefficients).
What is R-squared?
R-squared (R²), also known as the coefficient of determination, is a statistical measure that indicates the proportion of variance in the dependent variable explained by the independent variables in a regression model. It ranges from 0 to 1 (or 0% to 100%) and helps assess how well the model fits the observed data.
Interpretation of R-squared
- R² = 0 → The model explains none of the variation in the dependent variable.
- R² = 1 → The model explains 100% of the variation (perfect fit, rare in real-world data).
- Example: If R² = 0.70, the model explains 70% of the variability in the outcome.
The F test serves as a measure of overall significance of estimated regression model and also to test statistical significance of the computed R-square.Let’s see how the R square and F statistic are related.
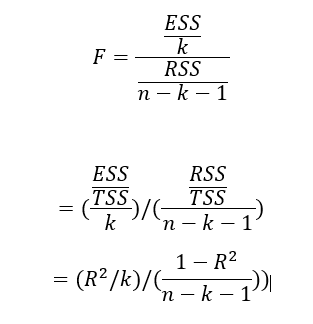
So, it is possible to derive the F statistic value by substituting the computed R square value in the above equation. If F statistic is statistically significant, it implies that computed R-square is also statistically significant.
Hope you found this post helpful. Happy learning 🙂