The Indifference curve shows combinations of food and clothing that yield equal satisfaction and among which the consumer is indifferent. In the diagram below, point ‘g’ is more preferred than point ‘h’. The slope of tangent ‘T’ gives the marginal rate of substitution at point ‘b’. Moving down the curve from ‘b’ to ‘f’, the slope of the tangent flattens showing that the more food and less clothing the consumer has, the less willing he will be to sacrifice further clothing to get more food.

Shapes of Indifference Curve:
Various consumer taste patterns can be demonstrated through indifference curves as shown below
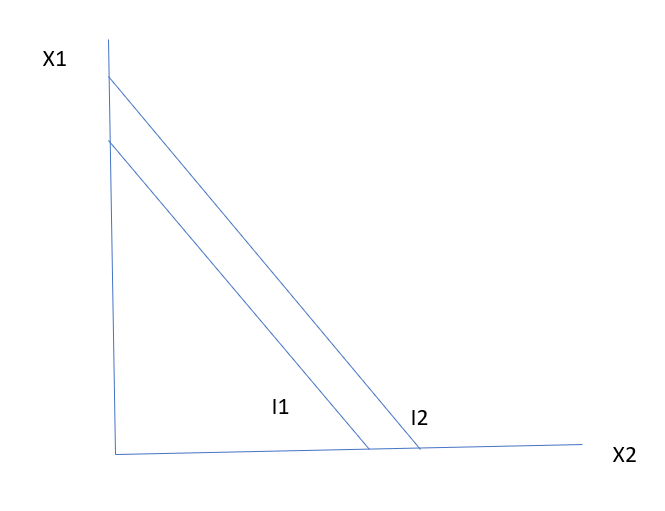
Perfect Substitutes : A red ball and a green ball can be perfect substitutes for a consumer. He might be willing to substitute one type of ball for another at a rate of one for one. the indifference curves would thus be a set of parallel lines with a slope of -1. Indifference curves for perfect substitutes are straight lines whose slopes indicate the rate at which one good can be substituted for the other.
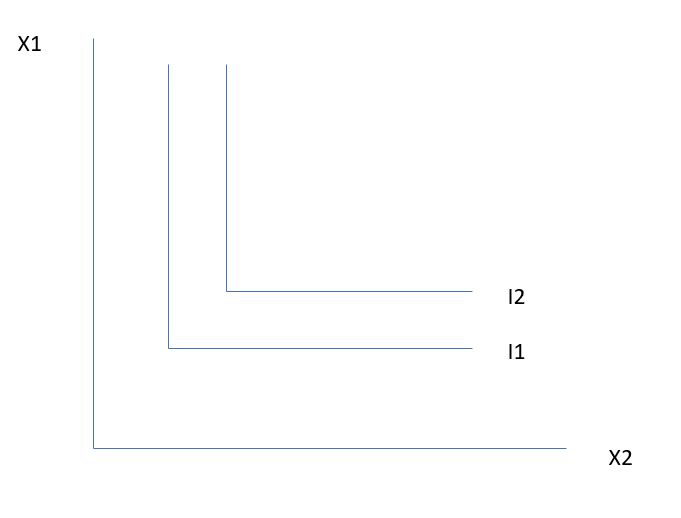
Perfect Complements : Left and right ankle socks are perfect complements as one of them is of no use without the other. There is no rate at which a consumer will likely to substitute one sock with another. The indifference curves for perfect complements are ‘L’ shaped.
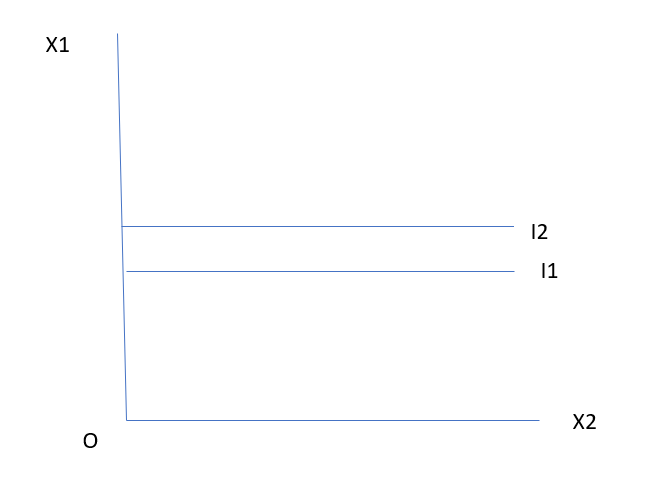
A zero utility product for a consumer : For a consumer a particular product may be of no use and hence, he will be unwilling to sacrifice even the smallest amount of any other good to obtain any quantity of that zero utility product. For example, for a vegan person meat will be completely useless. For these cases Indifference curves will be horizontal straight lines.