We apply linear regression techniques when we try to predict a continuous dependent variable. Hence the predicted output also becomes a continuous variable. Now let’s try to find out what are the model performance metrics that we can test or check to find out if the output looks stable and consistent.
Overall Fit : When we look at a model’s overall fit the most used metric is adjusted R square which tells us how much variation our explanatory variables (X) are capturing for our dependent variable (Y). Also, if we want to look at the statistical significance of the overall model fit we can check the F statistics and the corresponding p value. A p value lesser than the critical value at chosen significance level will imply that my model is overall significant. You can check it in details in these posts here and here.
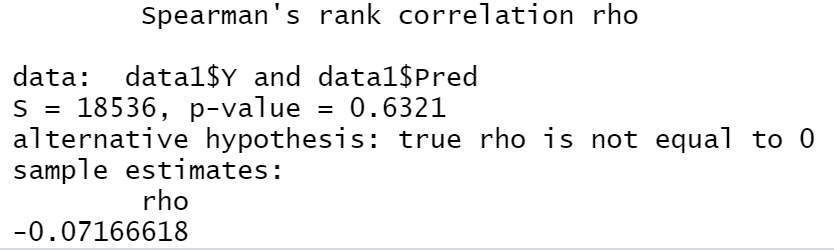
Spearman Rank Correlation : To test the degree of association between our original dependent variable (Y) and the fitted/predicted Y variable we can test the Spearman Rank correlation. You can check the post here to understand the difference between Pearson correlation and Spearman Rank correlation and also how you can do it in MS excel. The reason behind checking Spearman Rank correlation is check the consistency of the predicted output. The advantage of Spearman rank correlation is that it helps us to not only understand the strength of the correlation but also the direction (negative or positive). The code for Spearman Rank correlation in R is pretty straight forward as shown below. Here ‘ data1’ is our dataset which contains the original Y variable and another variable called ‘Pred’ which is basically the predicted output. Note: in the method =”spearman” part if we change it to “pearson” it will give us the Pearson correlation coefficient. So in the output below ‘rho’ is the actual Spearman rank correlation coefficient which is – 0.072 and the p value is 0.6321.So we can conclude that the correlation coefficient is not significant. In general a correlation coefficient which is closer to +- 1 implies stronger association. On the other hand the p value will tell us the statistical significance of the correlation coefficient. When we work on real life data it is quite possible that having a 60% correlation means the output is pretty great!

Root Mean Square Error (RMSE) and Mean Absolute Error (MAE) :
Simply put to calculate RMSE we need to follow 3 steps:
1. Square >>> We need to square the residuals ( residual = Y – Predicted Y)
2. Mean >>> We need to find the mean of the squared residuals
3. Root >>> We need to calculate the square root of the mean of the squared residuals
Now why are we doing this? Basically we are trying to find out the standard deviation of our prediction error or residual. So the lower the error the better is my model. Similarly the lower the RMSE the better is my model. Usually in real life we often keep the cut off for RMSE at 40% which implies that more than 40% will bring some additional checks but of course this cutoff varies on a case by case basis.
We have another rather similar metric known as Mean absolute Error (MAE).The formula is simpler than RMSE to be honest. So the steps are as follows:
1. Absolute Error >>> We need to add all the residuals by taking their absolute values i.e. | Y – Ypred|
2. Mean >>> Then we simply need to calculate the mean of the summation of absolute errors i.e. divide the aggregate absolute error by number of observations.
Now there are some differences between RMSE and MAE conceptually. Personally I have seen people using RMSE more than MAE. For RMSE the errors are squared before taking the average of it so RMSE penalizes larger error more. Anyway both of these metrics can be quite useful to check the accuracy of the prediction.

Let’s calculate RMSE in R. So I have just imported a random dataset ‘data1’.We need to install package ‘Metrics’ to run ‘rmse’ function in R. Note ‘Y’ and ‘Pred’ are the dependent variable and predicted output respectively.

For MAE as well we need to run library ‘Metrics’ and call the function ‘mae’ and it will give you the direct output. Please note that all the values for RMSE and MAE lie between 0 and 1. We can also express it in terms of percentage.
Trackbacks/Pingbacks