Imagine walking into a room full of strangers at a party. You don’t know anyone, but you notice that people seem to form little groups — maybe based on similar interests, conversations, or just standing close to each other. That’s clustering in action — and in the world of data science, K-means clustering is one of the simplest, yet most powerful tools to do just that: find natural groupings in data without any labels.
In this post, I will walk you through K-means clustering in plain English, explain how it works, when it works best, and what to watch out for.
What is Clustering?
Clustering is all about grouping similar items together. If you have a bunch of data points and no labels, clustering algorithms help you discover structure or patterns — for example, grouping customers based on purchase behavior or grouping genes based on expression levels.
Formally:
Given n data points, divide them into K groups (clusters) such that:
- Data points within the same cluster are very similar
- Data points in different clusters are less similar
But how do we define “similar”? That’s where distance metrics come in — most commonly, the Euclidean distance (i.e., straight-line distance between two points).
What is K-Means Clustering?
K-means is a centroid-based algorithm. Think of it as a game of hot and cold:
- You randomly place some centroids (cluster centers),
- Then points are assigned to the nearest center,
- Then you move the centers to the middle of their assigned points,
- Repeat until nothing changes.
The Goal
Minimize the total squared distance between data points and their nearest cluster center. Mathematically, K-means tries to minimize:

Where:
- Ck = cluster k
- μk = centroid of cluster k
- xi = data point
How Does K-Means Work?
Let’s break it down step-by-step.
Step 1: Initialize
Randomly pick K points as initial centroids (cluster centers). This is crucial — a bad start can lead to bad clusters.
Step 2: Assignment
Each data point finds the nearest centroid (using Euclidean distance) and assigns itself to that cluster.
Step 3: Update
For each cluster, compute the mean of the points assigned to it. This becomes the new centroid.
Step 4: Repeat
Repeat steps 2 and 3 until the centroids don’t move anymore — that’s your final clustering!
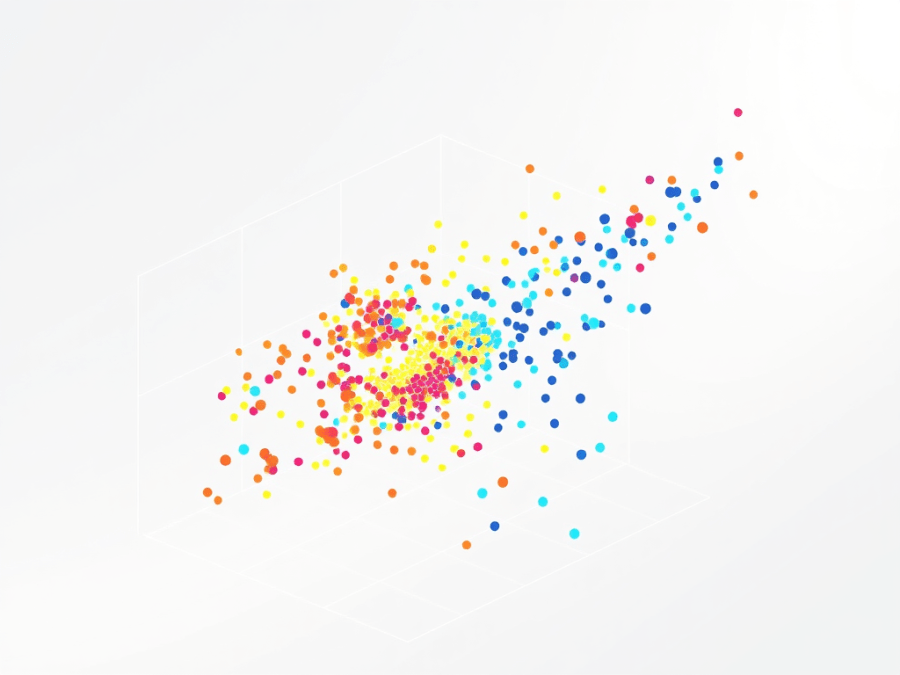
Intuition Through Example
Let’s say you have data about customer spending — one axis is how much they spend on food, the other is how much they spend on clothes.
- You want to group them into 3 clusters based on these two features.
- You run K-means with K=3K = 3K=3, and voila — you find one group of high spenders, one group of budget-conscious customers, and a middle-tier group.
All without using a single label. That’s the magic of unsupervised learning!
But There’s a Catch…
K-means is not perfect. Here are some things to watch out for:
Local Optima
K-means doesn’t guarantee the best possible solution — it may settle into a “good enough” configuration depending on the initial centroids.
Sensitive to Initialization
Bad starting points can lead to bad clusters. That’s why algorithms like K-means++ were developed — they choose better starting centroids.
Assumes Spherical Clusters
K-means assumes that clusters are round-ish (like blobs). So if your data has weird shapes (like moons, spirals), K-means may do a poor job.
When Should You Use K-Means?
✅ Use K-means when:
- Your data has roughly spherical or convex clusters
- You can estimate K (number of clusters)
- You want speed and simplicity
❌ Avoid K-means when:
- Clusters are non-convex (like spirals)
- You have lots of categorical data (K-means uses distance metrics that don’t work well with categories)
Bonus: How to Choose K?
A common method is the Elbow Method:
- Run K-means for different values of K (say, 1 to 10)
- Plot the total within-cluster sum of squares
- Look for the “elbow” — the point where adding more clusters doesn’t help much
Summary: Why K-Means Is Still Awesome
Despite its flaws, K-means remains a go-to clustering algorithm because it’s:
- Fast
- Simple to implement
- Easy to understand
- Scales to large datasets
Final Thoughts
K-means clustering is a great first step into the world of unsupervised learning. It’s like giving your data a compass — no labels, just structure. While it has its limitations, K-means can often uncover powerful insights with minimal effort.
Try running it on your own dataset — maybe your Spotify listening habits, your spending, or even your workout patterns. Who knows what natural groups you’ll uncover?